
‹ Unlocking the Power of Atlas
Unlocking the Power of Atlas (6): Call Graphs
A call graph records which functions call which, and Atlas can draw it or query it.
In the previous article, we explore how Atlas performs the foundational Control flow and Data flow analyses. In this article, we will be looking at Call Graphs in Atlas. Call graphs are a critical component in software analysis, representing the call relationship between functions or methods in a codebase. They are essential for understanding dependencies, identifying performance bottlenecks, detecting recursion, and uncovering dead code. Whether you’re refactoring legacy systems, optimizing performance, or analyzing potential vulnerabilities, call graphs serve as a foundational tool for gaining a deeper understanding of how your software operates.
Atlas automatically extracts call relationships from the indexed codebase, generating call graphs that provide a clear picture of function interactions. What makes Atlas especially powerful is its ability to refine these call graphs to the required precision. For instance, you can implement advanced algorithms like Variable Type Analysis to gain deeper insights. This is made possible by the powerful Atlas query language.
In this article, we’ll focus on the essentials call graphs in Atlas, discussing how Atlas represents them, how to visualize them, and how to process them.
Call Relations in Atlas
Atlas represents the call relation with an edge of the kind XCSG.Call. If a function f call function g, then Atlas representation would be two nodes of kind XCSG.Function representing the functions f and g.
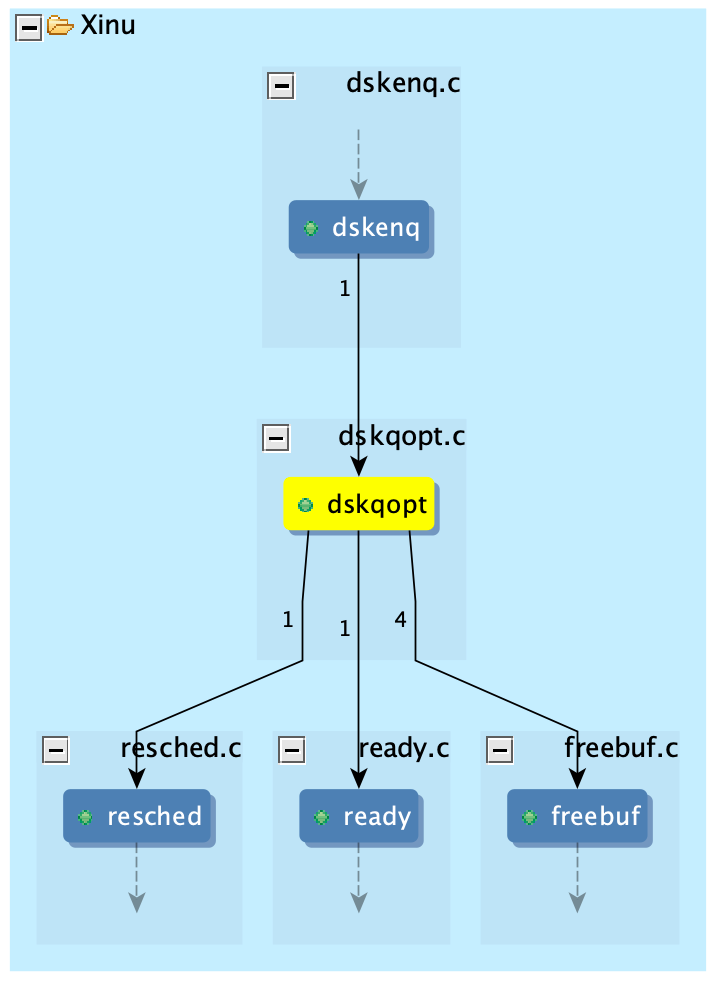
Example of a Call Graph in Atlas. It shows the function dskqopt calls functions resched, ready, and freebuf while the function dskenq calls dskqopt. Note the label 4 on the edge between dskqopt and freebuf. It means there 4 occurrences of a call to freebuf (callsite) in dskqopt.
Atlas also captures the multiplicity of a call, i.e. how many times the function g is called by function f. In other words, how many callsites are there. This is shown as a label on the edge when visualized. It goes without saying that this is because Atlas also extracts and saves the relationship between a call statement and the function invoked.
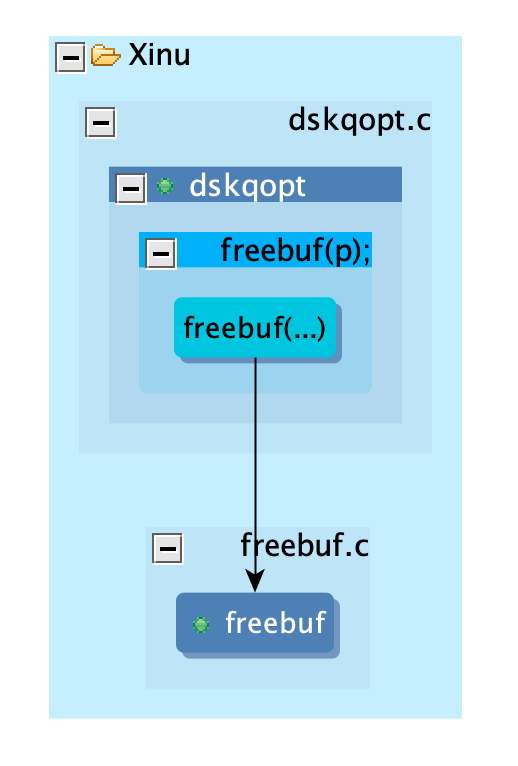
Atlas also captures the “invoke” relationship. This diagram shows how Atlas links a callsite to its target function.
Atlas creates a data flow node within the call statement (read more about how Atlas represents Control and Data Flow here). It is of the kind XCSG.CallSite. This node is connected to the function node that represents the target function of the invocation. This edge is of the kind XCSG.InvokedFunction. If the invocation is made using a function pointer, the edge is of the kind XCSG.InvokedPointer and connects to a node representing the function pointer. The function pointers can then be resolved by writing custom analyzers coupled with Atlas’s Data Flow.
Visualizing Call Graphs
Atlas offers two convenient ways to visualize call graphs: using the “Call” smart view or writing a simple query in the Atlas Shell.
To use the Call smart view, open the Atlas smart view interface and select the “Call” option. From there, navigate to your source code and click on the function name you want to analyze. The smart view will display both the callers (functions that call it) and callees (functions it calls). You can also incrementally expand the call relationships one step at a time, making it easy to explore the graph interactively. This approach is perfect for quickly understanding the calling structure of your code.
Atlas Shell is a powerful tool for scripting quick queries to perform call graph analysis. Since Atlas represents calling relationships as a graph, you can use simple traversal queries to fetch the desired call graph.
For example, the following query retrieves the entire call tree rooted at a specific function, foo:
universe.edges(XCSG.Call).forward(functions("foo"))This query returns all functions called by foo, along with the functions they call, and so on. It’s a straightforward way to explore the full extent of a function’s calling relationships, making it a valuable technique for deeper analysis of your codebase.
Similarly, you can use a reverse query to retrieve all the callers of a specific function. For instance:
universe.edges(XCSG.Call).reverse(functions("foo"))This query will return all the functions that call foo, along with the chain of their callers.
If you prefer to explore the call graph incrementally, Atlas provides forwardStep() and reverseStep() queries. These allow you to traverse the graph step-by-step, fetching only the direct callees or callers of a function, respectively. This approach is particularly useful for focused analysis or when dealing with large, complex call graphs.
That wraps up the basics of Call Graphs in Atlas. By leveraging its powerful query language, Atlas enables advanced analyses like dead code detection and recursion detection. These capabilities open up endless possibilities for understanding and optimizing your code. We’ll explore these more sophisticated analyses in a future article — stay tuned!
Similarly, the reverse query can be used to get the callers of the desired function. If you wish to explore the call graph step by step, then forwardStep or reverseStep queries can be used as they only fetch the direct callees or callers respectively.