
‹ Unlocking the Power of Atlas
Unlocking the Power of Atlas (3): Harnessing Atlas Shell for Software Analysis
Atlas Shell is the command-line side of Atlas, for queries and scripts when a Smart View is not the right tool.
Atlas is designed to make software analysis as interactive as possible. Its Smart Views are provide excellent graphical interface to analyze software on-the-fly. However, there are scenarios where an analyst may wish for a command-line interface capable of executing scripts. In that case, Atlas Shell subs in for Smart Views. Atlas Shell is a versatile interface that allows developers to query, analyze, and visualize the graph representations of their projects and to streamline analysis tasks.
Atlas Shell: A Command-Line Gateway
Atlas Shell is designed to interact with the graph representation that Atlas creates for your codebase. It allows developers to:
- Select code artifacts based on properties.
- Perform computations, such as counting artifacts like loops or branches.
- Visualize the results interactively for deeper insights.
- Streamline Analysis Tasks
This is made possible by Atlas’s query language. The query language is based on the graph database schema of Atlas. More details can be found in our whitepaper [1].
Let’s see Atlas Shell in action with a simple example.
Atlas Shell in action: Finding nested loops in a function
Navigating to Atlas Shell is easy:
Open Atlas Shell
- Select Open Atlas Shell from the Atlas menu.
- A new window titled Atlas Shell will appear, typically docked at the bottom of the screen. You can reposition it for convenience.
As an example, we will show how to find nested loops in a given code. For simplicity, we use the example code in figure that contains just one function. The same procedure can easily handle code with hundreds of thousands of functions.
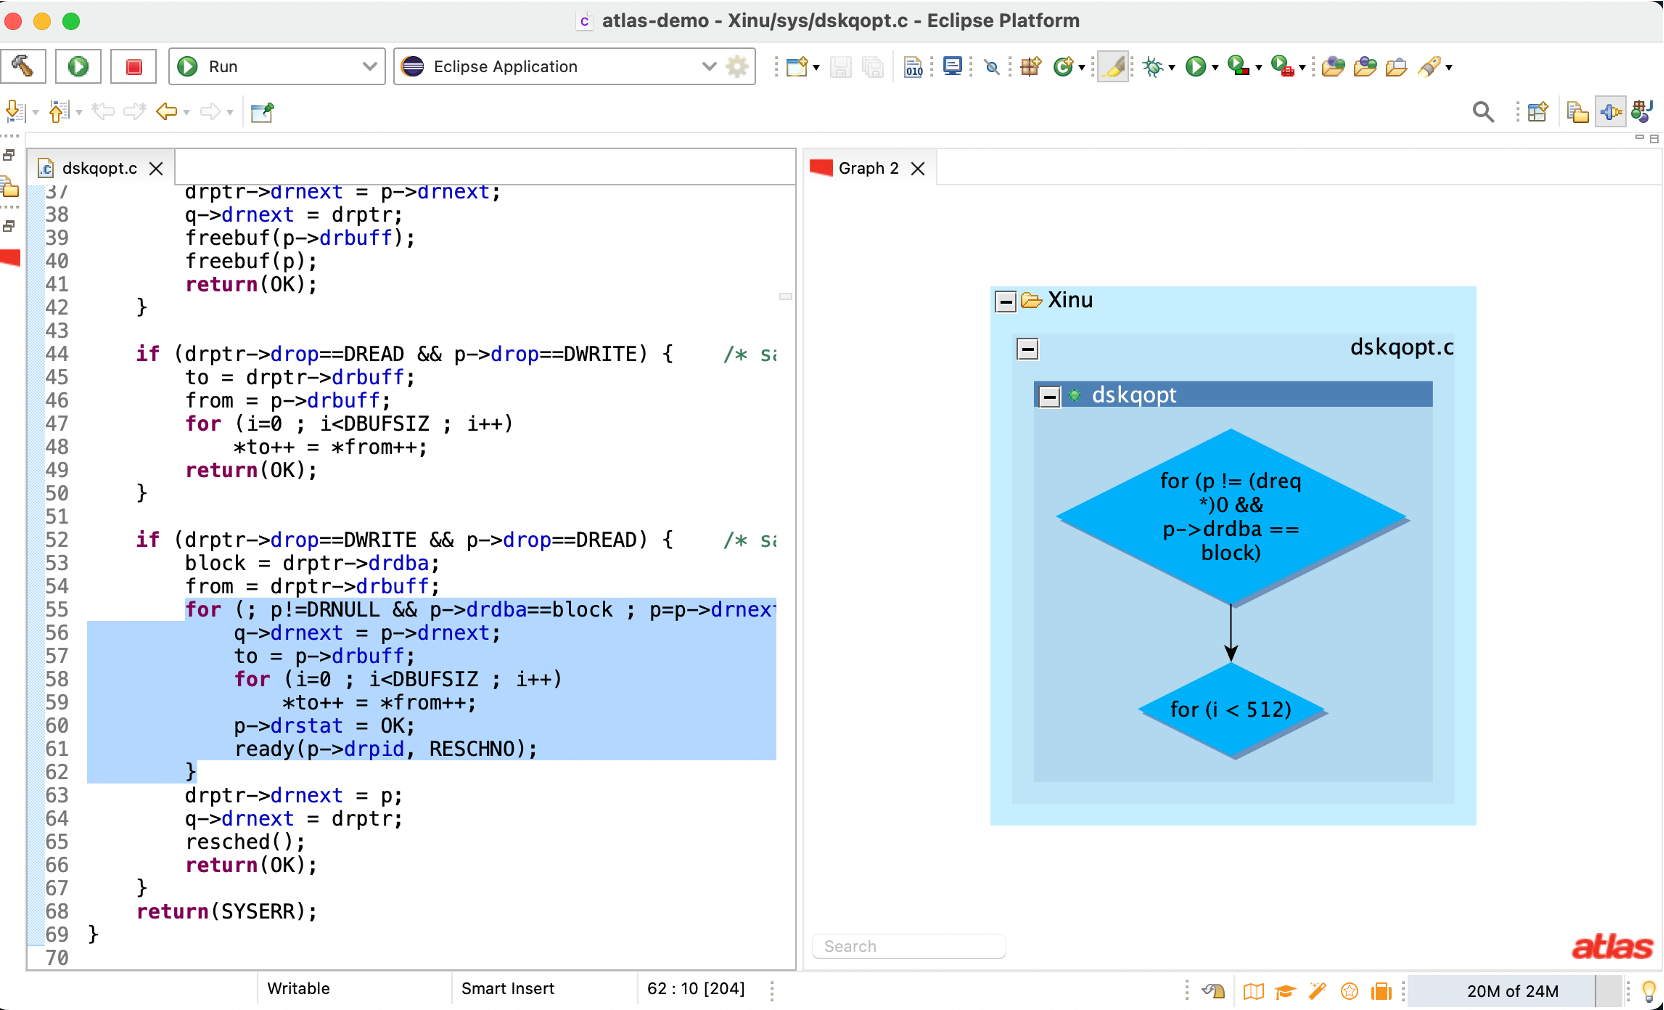
Finding Nested Loops: We are interested in detecting the highlighted portion of the code. On the right is the result of the queries that follow. It captures the two nested loop headers (outer and inner).
The following set of queries capture the nested loops in a given function.
var dskqopt = functions("dskqopt")
var dskqoptCFG = cfg(dskqopt)
var dskqoptLoops = dskqoptCFG.nodes(XCSG.Loop)
dskqoptLoops.eval.nodes.size   // = 3
var nestedLoops = universe.edges(XCSG.LoopChild).between(dskqoptLoops,
                                                         dskqoptLoops)
nestedLoops = nestedLoops.retainEdges
show(nestedLoops)
Let’s discuss them briefly.
- Create a variable for the code you are interested in. In this case we are interested in just one function — dskqopt. We used the functions() query for that. You can replace it with entire code base (universe()) without any modifications to the rest of the queries.
- We next compute Control Flow Graph (CFG) for dskqopt. The CFG captures all the program statements in dskqopt, including the loops. The cfg() query is for that purpose.
- Atlas tags program statements that represent a loop header as XCSG.Loop. We can select them using the .nodes() query. There are three of them.
- Loop nesting is a binary relation where an inner loop is contained within an outer loop. Atlas represents it and many such relations as edges in the graph. This particular relation is represented by the edge type XCSG.LoopChild. We can use the between() query to capture nested loops — both outer and inner. between() is a traversal query. It performs a graph traversal between specified start and end nodes using only the specified type of edges and captures the subgraph “between” the two nodes.
- In the above query, if there are no nested loops, we have no edges to traverse and we are left with disconnected subgraphs. These need to removed as we are only interested in nested loops. The query retainEdges() does exactly that.
- Finally, using show() query we can visualize the result of our analysis.
These queries can be canned as a program and be made part of an analysis pipeline. They can be modified so that not just loop headers, but the loop body is also computed. It is also possible to export the results of these queries in text. We will be writing more stories exploring the details of all the things Atlas Shell is capable of. Watch this space for more!
Why Atlas Shell Stands Out
Atlas Shell transforms code analysis into a dynamic and intuitive process. Its power comes from the versatile query language supported by the graph database schema. By combining it with the visualization capabilities of Atlas, developers can:
- Navigate complex relationships in code with ease.
- Gain insights into control flows and dependencies.
- Extend their analysis to areas like cybersecurity and performance optimization.
- Streamline analysis tasks in your workflow.
Atlas Shell unlocks the powerful query language provided by Atlas. Its ability to query, compute, and visualize data makes it indispensable for analyzing large and intricate codebases. So, the next time you’re faced with a challenging software analysis problem, Atlas Shell is your friend.
References
[1] A Humane, Graph-Based Representation of Programs and Analyses, Whitepaper: https://ensoftupdate.com/papers/XCSGWhitepaper.pdf