
4. Results and Discussions
4.1 Summary
By the end of Phase I of the DARPA APAC project, our team audited 77 Android applications developed by the Red team, of which 62 contained novel malware. A control team was employed beginning with engagement 1C to use current state of the art tools to audit the apps alongside Blue team performers. Our process correctly identified malice in 57 (91.94 %) of the malicious apps and correctly classified 66 (85.71 %) apps as malicious or benign. We found 6 unintended malicious behaviors, and missed malware in only 5 (6.49 %) of the apps consistently beating the control team. We completed Phase I as the top performing Blue team.
At the end of Phase I (starting with engagement 2B) the nature of the malware in the challenge applications began to change from what was primarily seen in Phase I. The malware became much more difficult and we saw the performance of all teams including the control team reduced. Over the course of Phase II, our team audited 28 challenge applications developed by the Red team, of which 25 contained novel malware. Our process correctly identified malice in 18 (72 %) of the malicious apps and correctly classified 25 (89.29 %) apps as malicious or benign. We found 35 unintended malicious behaviors, and missed malware in 7 (25 %) of the apps beating the control, but not by as much in Phase I.
According to metrics provided at the PI meetings, we determined that we maintained our position in Phase II among the top 3 performing teams and weren’t far behind the leading team.
4.2 Analyst Backgrounds
The participating analysts included throughout the engagements included graduate students, a staff member from the ISU research group (the staff member has an MS in Computer Engineering), undergraduate research assistants, and software engineers from ENSOFT. During engagement 1A there were 6 analysts, but for every engagement thereafter there were only 2-4 analysts working on challenge application audits per engagement.
4.3 Analysis Process
Before the actual analysis, one person spent 1-2 hours to survey application size and prepare all apps as Eclipse projects to be ready to audit. After preprocessing apps, two analysts were assigned to each app. Each analyst worked independently and did not have access to the work of other analysts. A coordinator who oversaw the process but did not audit apps reviewed the results of the analysis done by each analyst. An additional analyst was assigned to audit an app by the coordinator if the results from the original two analysts were deemed to be in conflict or inconclusive. All analysts worked independently without access to the results of analysis done by other analysts. A single report for each application was chosen at the end of the experiment to submit in the collection of final reports.
An emulator was used to verify the malicious behavior after the malware and triggers were discovered and reported by the analyst. Emulation was not used to detect malware; it was done strictly to observe the malicious behavior predicted by our analysis. In some cases, we could not observe the malicious behavior, but we have still reported the application as malware because we were certain of the presence of a malicious payload based on our analysis.
4.4 Engagement Results
It is difficult to interpret the results of the engagements for many reasons. The experimental setup of each engagement evolved as engagements progressed. A control team was not added until engagement 1C and the difficulty of the malware increased drastically starting with engagement 2A. In early Phase I some malicious applications contained more than one malware, while later engagements reduced the malicious surface area by limiting the malware to a single malicious behavior. In engagement 1B we were tasked with finding all malwares. Starting with engagement 2B we were given access to a human oracle that confirmed malice when presented with the correct evidence. While the main idea of the oracle persisted to the end of Phase II, the oracles official response policy changed over engagements. The oracle was intended to stop teams from “short circuiting” on unintended malice. Engagements 1C, 2B, and 3B were onsite and had limits on the number of analysts (4, 3, and 3 respectively) and limits on time (8, 4, and 5 hours respectively). A few select applications in engagement 3B and 4A were “updates” to existing applications in previous engagements so that previous knowledge could be drawn upon for during the audits. Beginning with engagement 1B, application support libraries came “packed” into the source instead of as dependent JAR libraries and were considered in scope of the audit. During engagement 4A all apps were known to be malicious, as opposed to previous engagements where the classification of the application was unknown.
| Engagement | # Apps | # Malicious Apps | # Benign Apps | # Malwares |
|---|---|---|---|---|
| 1A | 26 | 21 | 5 | 29 |
| 1B | 16 | 14 | 2 | 16 |
| 1C | 10 | 7 | 3 | 7 |
| 2A | 16 | 13 | 3 | 15 |
| 2B | 9 | 7 | 2 | 8 |
| 3A | 10 | 8 | 2 | 8 |
| 3B | 4 | 3 | 1 | 3 |
| 4A | 14 | 14 | 0 | 14 |
| Phase I | 77 | 62 | 15 | 75 |
| Phase II | 28 | 25 | 3 | 25 |
| Total | 105 | 87 | 18 | 100 |
Not counting a dry run practice engagement, which had 8 challenge applications, our team completed 105 application audits. Of the 105 applications, 87 were officially classified as malware containing 100 individual officially malicious behaviors.
| Engagement | Average Java Files | Average Java LOC | Average XML Files | Average XML LOC | Average Other Files | Average Other LOC | Average Comments | Average Libraries |
|---|---|---|---|---|---|---|---|---|
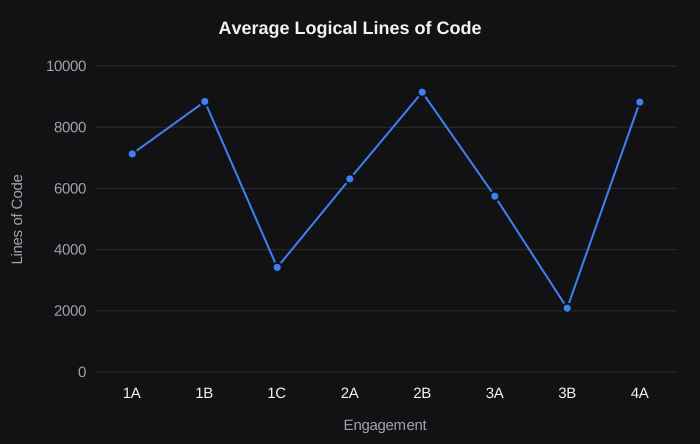
| 1A | 65.65 | 7128.08 | 24.46 | 1778.77 | 4.08 | 922.77 | 3145.46 | 0.81 |
| 1B | 80.5 | 8841.44 | 49.31 | 2233.25 | 0.56 | 83.94 | 4498.31 | 0.5 |
| 1C | 28 | 3417.8 | 27.1 | 1965.3 | 0 | 0 | 2548.4 | 0 |
| 2A | 50.44 | 6310.19 | 18.44 | 400.75 | 0 | 0 | 2095.81 | 0 |
| 2B | 70.56 | 9144.33 | 17.89 | 530.56 | 0 | 0 | 9807.56 | 0 |
| 3A | 53.8 | 5743.7 | 24.3 | 813.8 | 0.1 | 25.5 | 2686.5 | 0 |
| 3B | 18 | 2083.5 | 16.75 | 383 | 1.75 | 62.25 | 194.25 | 0 |
| 4A | 89.86 | 8819.29 | 17.79 | 604.79 | 0 | 0 | 4190.5 | 0 |
| Phase I | 61.26 | 7067.96 | 27.95 | 1465.19 | 1.49 | 329.03 | 3909.61 | 0.38 |
| Phase II | 66.71 | 6758.61 | 19.96 | 647.75 | 0.29 | 18 | 3082.46 | 0 |
| Total | 62.71 | 6985.47 | 25.82 | 1247.21 | 1.17 | 246.09 | 3689.04 | 0.28 |
| Engagement | Correct Classification | Correctly Identified Malice | Missed Detections | Unintended Malware |
|---|---|---|---|---|
| 1A | 88.46 % | 95.24 % | 3.85 % | 2 issues |
| 1B | 87.5 % | 100 % | 0 % | 2 issues |
| 1C | 90 % | 100 % | 0 % | 1 issue |
| 2A | 81.25 % | 84.62 % | 12.5 % | 1 issue |
| 2B | 77.78 % | 71.43 % | 22.22 % | 0 issues |
| 3A | 80 % | 62.5 % | 30 % | 4 issues |
| 3B | 100 % | 0 % | 75 % | 10 issues |
| 4A | 92.86 % | 92.86 % | 7.14 % | 21 issues |
| Phase I | 85.71 % | 91.94 % | 6.49 % | 6 issues |
| Phase II | 89.29 % | 72 % | 25 % | 35 issues |
| Over Both | 86.67% | 86.31 % | 11.43 % | 41 issues |
| Engagement | Total Analysis Time | Average Analysis Time |
|---|---|---|
| 1A | 29.72 hours | 1.14 hours |
| 1B | 13.44 hours | 0.84 hours |
| 1C | 8.24 hours | 0.82 hours |
| 2A | 26.35 hours | 1.65 hours |
| 2B | 9.03 hours | 1.00 hours |
| 3A | 83.98 hours | 8.40 hours |
| 3B | 13.01 hours | 3.25 hours |
| 4A | 160.20 hours | 11.44 hours |
| Phase I | 86.78 hours | 1.12 hours |
| Phase II | 257.19 hours | 9.19 hours |
| Over Both | 343.98 hours | 3.28 hours |
4.5 Engagement Observations
In engagements 1A the Red team created new small applications, less than 500 lines of code (LOC), and utilized existing open source applications ranging from 2K LOC to 60K LOC. The malice focused on breaking automation techniques. The general consensus was that the smaller applications were small enough to manually read to discover malware.
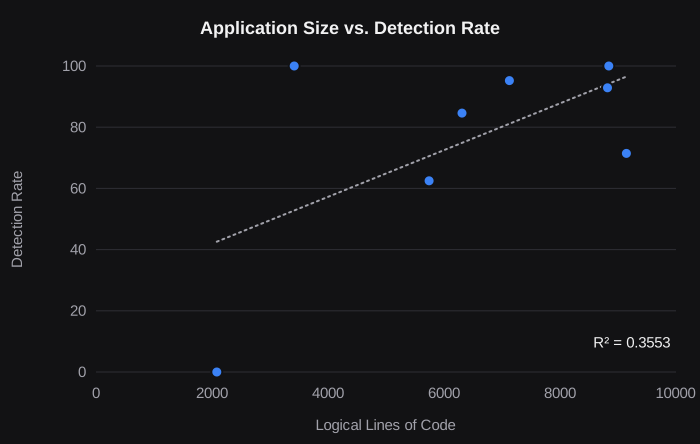
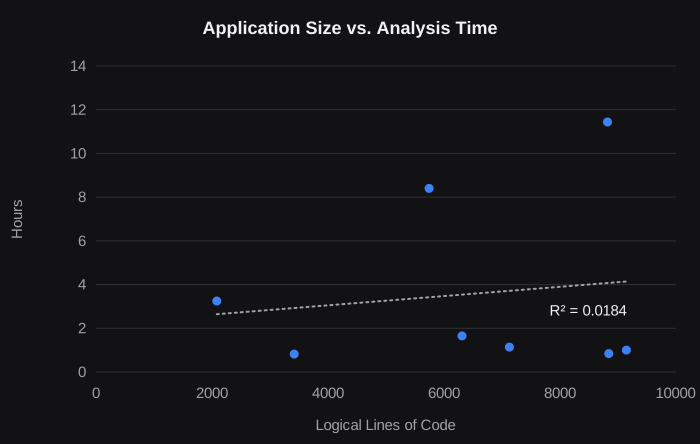
After engagement 1C all applications had a minimum of 1000 LOC. As we expected, our performance with respect to analysis time and correct detection of the intended malware was not correlated with the size of the application (see Figure 5 and Figure 6). This confirms our belief that the difficulty in finding the malware has less to do with the size of the code and more to do with the characteristics of the malware itself. For instance a malware that connects to the Internet and uses a class loader to execute code that it downloads when the application starts stands out like a sore thumb in an application that primarily works offline regardless of the size of the application. If the malware is blended with legitimate functionality and uses existing control flow and data flows for malicious purposes the task of detection becomes much more difficult even for applications of a few hundred lines of code. Engagements in Phase II tended to increase the difficulty by creating subtle domain specific malware that could not be modeled a priori and thus coming up with a good malware hypothesis became the bottleneck.
While the applications in 1A through 1C contained several modified open source applications, starting with engagement 2A the applications were developed from scratch. This simulated an adversary that was intimately familiar with the environment the source code. As an experiment the Red team hired an intern who produced large, complex, but poorly written application to confuse the human auditor. In other cases large sections of dead, broken, or unfinished code were intentionally added to increase the difficulty of discovering malicious behaviors. In such cases, the difficulty increased primarily due to poor code quality and not the size of the code.
The general complexity of the base applications also increased in later engagements. While applications in early engagements included apps such as a countdown timer, bible, screensaver, battery monitor, calculator, and backup utilities, later engagements included apps such as an AI Short Message Service (SMS) bot, a network scanner with custom programming language and interpreter shell, device administration utilities, and a device tracking system with a signature based firewall to prevent abuse. These applications took more human effort to understand and hypothesis potentially malicious behaviors.
Early engagements were almost entirely confidentiality based, which made it easy to hypothesize malware and analyze code for its presence. The types of malware that we failed to detect in Phase I were because of the difficult of generating malware hypothesis as such as malware that wasted battery by using an inefficient algorithm or an infinite loop in a background thread or issues that could have been detected with functional testing such a backup application that used a regular expression to incorrectly backup a Chinese phone number (flipping the 5 and 6 digits).
Near the end of Phase I we saw applications that maliciously collaborated with other applications. We also observed the difficulty of dynamic analysis increasing, presumably to thwart teams utilizing dynamic analysis approaches. This increased difficulty made the “trigger analysis” much more difficult because the malware would occur in a set of very precise conditions such as the 99th time an application was launched or after a menu 3 levels deep was selected on one screen and another menu was selected 3 levels deep on another screen. If one part of the malware was discovered, it was still difficult to figure out how that part could be triggered by another action or state in some other part of the application. In many of the later challenge applications, the malware itself was external to the application and what was left to discover in the application was more of a vulnerability that could be leveraged by a malicious interaction with the application. To make it more difficult these interactions tended to happen over custom protocols for which we only had the client libraries or interactions with a web server that was not provided during the audit, making it much more difficult to realize the big picture without additional time investments during the audit.
We saw our analysis time increase from an average of approximately 1 hour per application in Phase I to approximately 9 hours per application in Phase II. This became an issue during onsite engagements 2B and 3B where our maximum analysis time was capped at 4 and 5 hours respectively, resulting in poor performance. All Blue teams together could only discover two malwares in Engagement 3B.
Especially in engagement 4A, “decoy malwares” were placed near the official malware. These decoy malware looked and felt malicious to a human, but were somehow subtly broken or deactivated (but not always) so as to misdirect the human analyst’s suspicion down the wrong trail. These applications, while challenging, were not realistic in our opinion because malware authors tend not to intentionally draw suspicion to themselves.